 EMODnet Product Catalogue
Iv.Javakhishvili Tbilisi State University, Centre of Relations with UNESCO Oceanological Research Centre and GeoDNA (UNESCO)
Type of resources
Available actions
Topics
Keywords
Contact for the resource
Provided by
Years
Formats
Representation types
Scale 1:
Resolution
-
EMODnet Chemistry aims to provide access to marine chemistry data sets and derived data products concerning eutrophication, ocean acidification and contaminants. The chemicals chosen reflect importance to the Marine Strategy Framework Directive (MSFD). This regional aggregated dataset contains all unrestricted EMODnet Chemistry data on contaminants (48 parameters), and covers the Black Sea with 21504 CDI records divided per matrices: 7 biota profiles, 19677 water profiles, 1820 sediment profiles. Vertical profiles temporal range is from 1974-08-24 to 2017-10-06. Data were aggregated and quality controlled by ‘National Institute for Marine Research and Development "Grigore Antipa"’ from Romania. Regional datasets concerning contaminants are automatically harvested. Parameter names in these datasets are based on P01, BODC Parameter Usage Vocabulary, which is available at: http://seadatanet.maris2.nl/bandit/browse_step.php . Each measurement value has a quality flag indicator. The resulting data collections for each Sea Basin are harmonised, and the collections are quality controlled by EMODnet Chemistry Regional Leaders using ODV Software and following a common methodology for all Sea Regions. Harmonisation means that: (1) unit conversion is carried out to express contaminant concentrations with a limited set of measurement units (according to EU directives 2013/39/UE; Comm. Dec. EU 2017/848) and (2) merging of variables described by different “local names”, but corresponding exactly to the same concepts in BODC P01 vocabulary. The harmonised dataset can be downloaded as ODV spreadsheet (TXT file), which is composed of metadata header followed by tab separated values. This worksheet can be imported to ODV Software for visualisation (More information can be found at: https://www.seadatanet.org/Software/ODV ). The same dataset is offered also as XLSX file in a long/vertical format, in which each P01 measurement is a record line. Additionally, there are a series of columns that split P01 terms in subcomponents (measure, substance, CAS number, matrix...).This transposed format is more adapted to worksheet applications users (e.g. LibreOffice Calc). The 48 parameter names in this metadata record are based on P02, SeaDataNet Parameter Discovery Vocabulary, which is available at: http://seadatanet.maris2.nl/v_bodc_vocab_v2/vocab_relations.asp?lib=P02 . Detailed documentation will be published soon. The original datasets can be searched and downloaded from EMODnet Chemistry Download Service: https://emodnet-chemistry.maris.nl/search
-
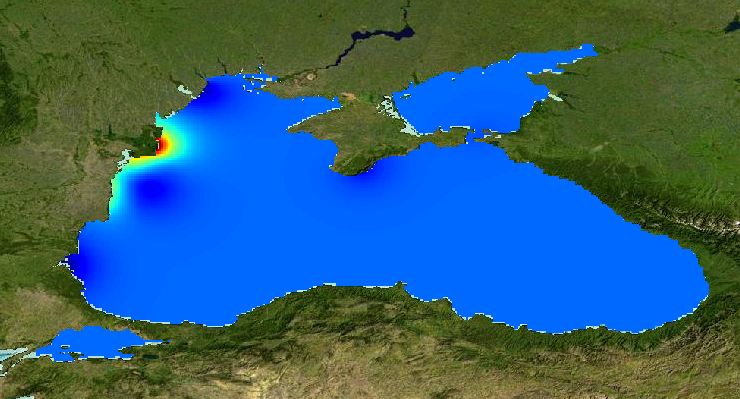
Gridded product for visualization of Water body nitrate plus nitrite in the Black Sea generated by DIVA 4.6.9 using all EMODNET Chemistry data from 1976 to 2013. Depth range (IODE standard depths): 0 – 150m. DIVA settings: signal-to-noise ratio and correlation length were estimated using data mean distance as a minimum (for L), and both parameters vertically filtered. Background field: the data mean value is subtracted from the data. Detrending of data: no. Advection constraint applied: no. Every year of the time dimension corresponds to a 10-year centred average for each season: - winter: December - February, - spring: March - May, - summer: June - August, - autumn: September – November Units: umol/l
-
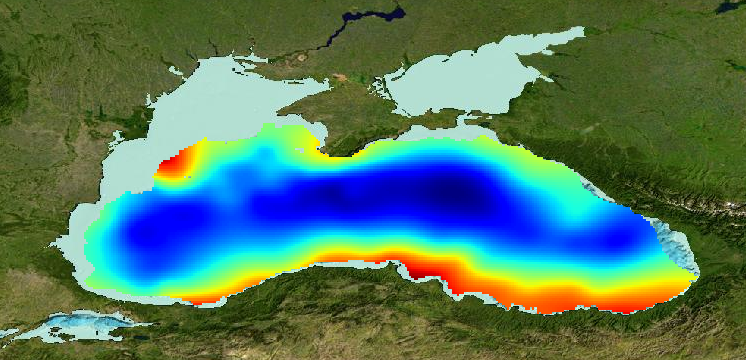
Gridded product for visualization of Water body dissolved oxygen concentration in the Black Sea generated by DIVA 4.6.11 using all EMODNET Chemistry data from 1970 to 2014. Depth range (IODE standard depths): 0 – 250m. DIVA settings: signal-to-noise ratio and correlation length were estimated using data mean distance as a minimum (for L), and both parameters vertically filtered. Background field: the data mean value is subtracted from the data. Detrending of data: no. Advection constraint applied: no. Every year of the time dimension corresponds to a 10-year centred average for each season: - winter: December - February, - spring: March - May, - summer: June - August, - autumn: September – November Units: umol/l
-
Annual sea surface water monitoring (chemical, bacteriological analysis)
-
Annual sea surface water monitoring (chemical, bacteriological analysis)
-
Annual sea surface water monitoring (chemical, bacteriological analysis)
-
Annual sea surface water monitoring (chemical, bacteriological analysis)
-
Annual sea surface water monitoring (chemical, bacteriological analysis)
-
Annual sea surface water monitoring (chemical, bacteriological analysis)
-
Annual sea surface water monitoring (chemical, bacteriological analysis)